Survey & Feedback
Good Survey Answers Examples (With 10 Proven Best Practices)
Article written by Kate Williams
Product Marketing Manager at SurveySparrow
14 min read
12 January 2026
")
60 Seconds Summary:
Good survey answers are just as important as good survey questions. Poorly written answer options confuse respondents, increase drop-offs, and ruin data quality.
In this guide, you’ll find real survey answer examples (good vs bad), along with 10 proven best practices to help you:
- Increase survey completion rates
- Reduce biased or inaccurate responses
- Collect clean, decision-ready data
If you want surveys people actually complete — this guide is for you. A lot of surveys fail not because of poor questions, but because of poorly written answer options.
A lot of surveys fail not because of poor questions, but because of poorly written answer options.
Think about the last survey you abandoned. Chances are, you couldn't find an answer that matched your opinion, or the choices were so confusing you gave up halfway through.
Well, it sucks if you don't get the response rate you want because well you want to make decisions based on it. But writing a good survey answer is a skill you can master, and it can drastically improve the response rate of your surveys, the data quality, and ultimately your business decisions.
If you’re looking for good survey answers examples, the easiest way to understand what works (and what doesn’t) is by comparing real-world examples side by side. Below, we’ll walk through multiple good vs bad survey answer examples across common question types, so you can apply these patterns to your own surveys.
What Makes a Good Survey Answer?
Before diving into theory, let’s get concrete with some solid examples of what makes good survey answers.
Bad examples of survey answers
- Overlapping options
- Missing relevant choices
- Biased or leading language
- Too many options to choose from
Good examples survey answers
- Clear, simple, and unambiguous
- Mutually exclusive and collectively exhaustive
- Neutral and balanced
- Easy to understand at a glance
Example: Bad vs Good Survey Answers
Question 1: How satisfied are you with our product?
❌ Bad
- Very satisfied
- Satisfied
- Somewhat satisfied
✅ Good
- Very satisfied
- Satisfied
- Neutral
- Dissatisfied
- Very dissatisfied
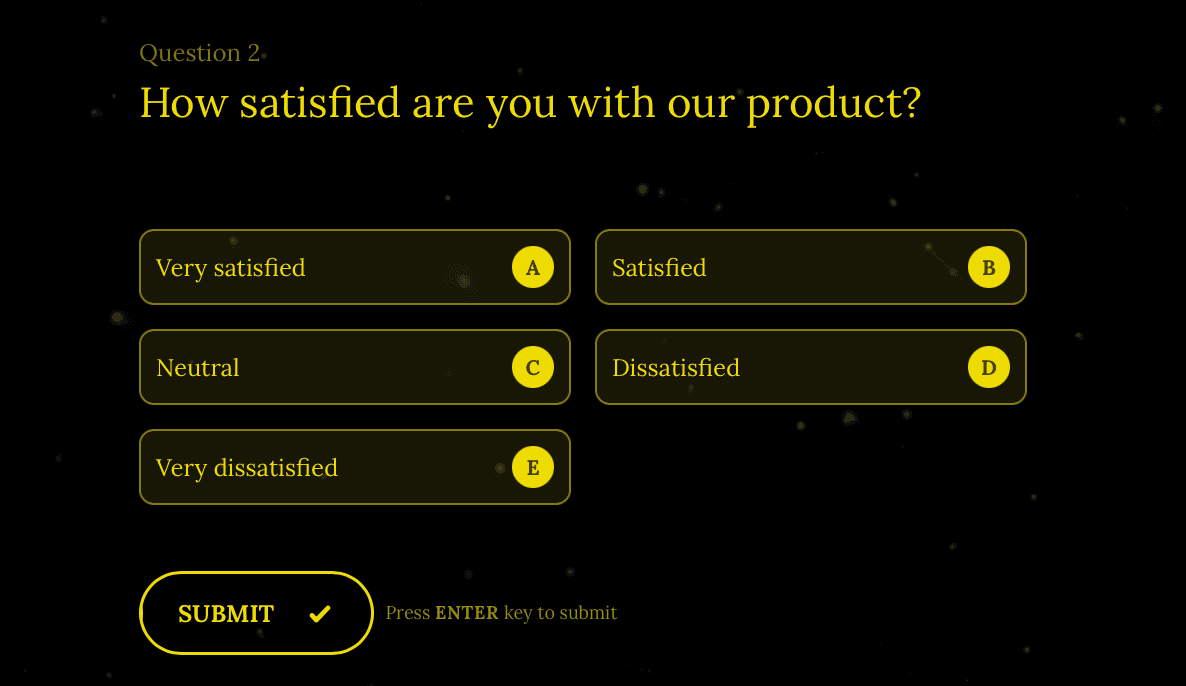
This single fix removes bias and dramatically improves data quality.
Question 2: Which feature do you use most often?
❌ Bad
- Dashboard
- Reports
- Analytics
- Other
(Too vague. Overlapping concepts. No clarity.)
✅ Good
- Dashboard (overview & summaries)
- Reports (exported or scheduled reports)
- Analytics (charts, trends, and insights)
- I don’t use any features regularly
Why this works:
The good example clearly defines each option and includes an alternative choice, making it easier for respondents to select an accurate answer.
Question 3: How often do you use our product?
❌ Bad
- Always
- Sometimes
- Never
(Vague and subjective. Respondents interpret these differently.)
✅ Good
- Daily
- A few times a week
- Once a week
- Once or twice a month
- Rarely
- Never
Why this works:
Specific frequency ranges remove ambiguity and help respondents choose an option that truly reflects their behavior.
Why Survey Answers Matter More Than You Think
Most surveys don’t fail because of bad questions — they fail because of bad answer options. Survey answers or response options are basically the foundation of quality data collection.
Survey answers (also called response options) form the foundation of quality data collection. If questions are unclear, or if answer choices overlap or miss key options, respondents struggle to provide accurate feedback.
While writing survey answers may seem straightforward, doing it well requires precision and intent. Writing effective answers is similar to writing effective questions — but with nuances that directly impact response quality and analysis.
In this guide, we'll walk you through 10 actionable tips with real examples which you can use to come up with precise, objective answers for your survey questions that increase response rates and deliver better data
These strategies are used by 4000+ teams on SurveySparrow to achieve response rates up to 40% more than how much they used to get.
Ready? Let's begin
Pro Tip: Not sure how to frame your answer options?
Access 1,000+ pre-written, research-backed survey answer options for every common survey question type — completely free.
- Save hours of survey design time
- Reduce bias and ambiguity
- Use answer options proven to improve response quality
👉 Build smarter surveys faster — without starting from scratch.
14-day free trial • Cancel Anytime • No Credit Card Required • No Strings Attached
1. Begin with the End in Mind
Before you write your answers, you need to know how you’re going to use them.
Ask yourself these:
- What are you looking to learn from your customers or users?
- What kind of response are you hoping to gather from your target audience?
- Will you need quantitative data for charts and reports, or qualitative insights for deeper understanding?
You’ll want to gain in-depth information about a complex topic or just a simple response in a word or two.
And for the analysis:
Close-ended questions are quantifiable making them easier to analyze and use for making informed decisions. But when it comes to open-ended questions, they are more complex to analyze but provide richer insights.
| Question type | Best for | Analysis method | Example |
|---|---|---|---|
| Close-ended | Quantitative data, trends, benchmarking | Charts, percentages, statistical analysis | "Rate your satisfaction: 1-5" |
| Open-ended | Qualitative insights, detailed feedback | Text analytics, theme identification | "What could we improve?" |
Pro Tip: Use AI to analyze open-ended survey answers
Open-ended survey questions are incredibly valuable — but they come with a challenge. As responses grow, unstructured text quickly becomes overwhelming, making manual analysis slow, inconsistent, and error-prone.
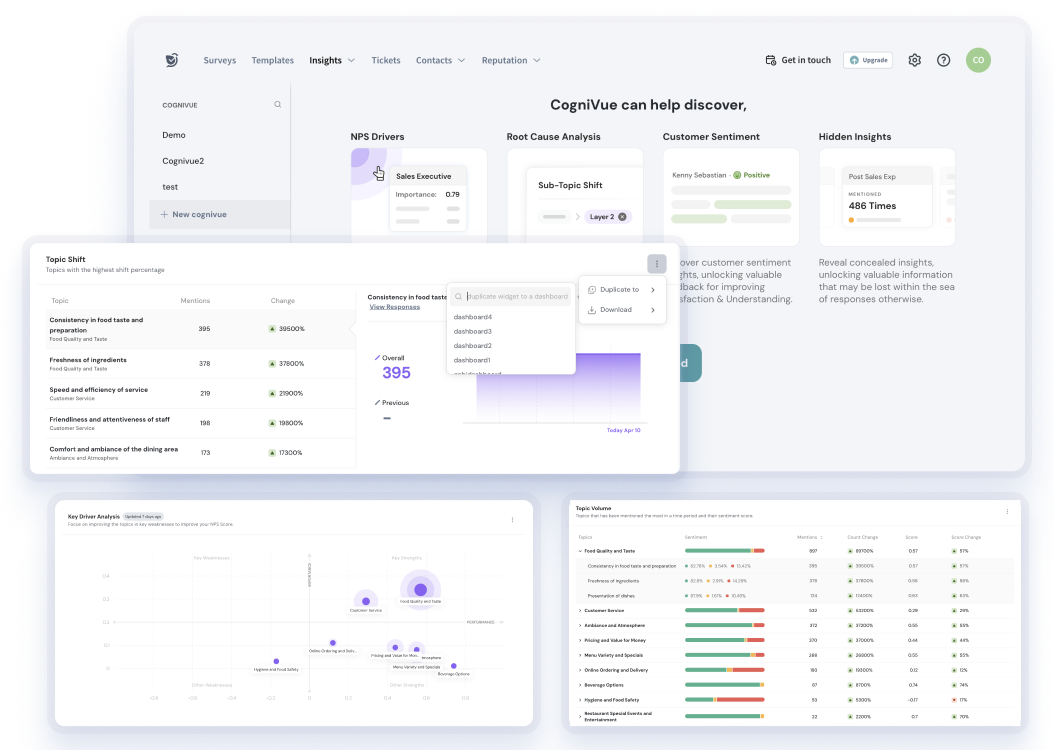
That’s where SurveySparrow’s AI-Powered Text Analytics, CogniVue, comes in.
CogniVue automatically analyzes thousands of open-ended responses using AI, NLP, and machine learning, helping you uncover insights in minutes — not weeks.
With CogniVue, you can instantly know the:
- most discussed topics across responses
- frequently used keywords and phrases
- customer sentiment and emotions (positive, neutral, negative)
- key drivers behind customer satisfaction or churn
Instead of reading every response line by line, you get clear themes, patterns, and insights — ready to act on.
How AI improves survey analysis, you may ask.
When analyzing open-ended survey answers manually, it’s easy to miss patterns across hundreds or thousands of responses. AI-powered survey analysis helps uncover customer satisfaction trends, recurring themes, and sentiment shifts automatically — making feedback analysis faster, more consistent, and far more actionable.
14-day free trial • Cancel Anytime • No Credit Card Required • No Strings Attached
2. Use Simple Language and Avoid Jargon
Your respondents shouldn't need a dictionary or Google search to understand your survey.
Avoid using industry words that survey respondents are not familiar with.
When you use jargon, you force your customers to use a dictionary or the internet to understand what you mean. This makes them frustrated and unhappy.
| Too Complex | Clear & Simple |
|---|---|
| "What is your preferred B2B SaaS deployment methodology?" | "How do you prefer to use our software?" |
| "Rate our omnichannel customer experience" | "Rate your overall experience with our service" |
| "Evaluate our UX/UI paradigm" | "How easy is our website to use?" |
Actions Steps:
- Double-check if you’ve included any overly technically or words with multiple meanings
- Use simple, direct language that your customers will find easy to understand. If you’ve used any acronyms or abbreviations, simplify them so respondents can understand them better
- Your answer options need to be immediately understood by your customers in order to get the responses you seek
- Test your survey with someone unfamiliar with your industry
Tip – Use AI to Generate Questions
SurveySparrow AI allows you to create surveys from scratch within minutes. It’s just like ChatGPT. Just put in the prompt and watch the magic unfold before you.
The AI feature is available in the free forever plan from SurveySparrow. So, feel free to try them out!
3. Answer Options Should Be Mutually Exclusive
One common mistake people make is to provide respondents with two similar answer options.
It can be confusing for your respondents to pick an option if there are two or more similar answer options.
You need to make sure that your answer choices are exclusive of each other and don’t overlap.
For instance, if the question below were to be asked to respondents whose age is 35, which option would they choose? The third or fourth option?
Which age group do you fall under?
- Under 18
- 18 – 25
- 25 – 35
- 35 – 45
- 45 – 55
- 55 – 65
The Rule:
Each respondent should be able to select one and only one, and that answer should accurately represents them.
Here’s an example that would help the respondents quickly pick a relevant answer.
Which age group do you fall under?
- Under 18
- 18 – 24
- 25 – 34
- 35 – 44
- 45 – 54
- 55 – 65
Your answer options need to be mutually exclusive so your respondents can make clear choices.
4. Good Survey Answers are Collectively Exhaustive
As a survey researcher, you need to make sure that you provide your respondents with every possible relevant question.
If a respondent can't find an answer that fits them, they'll either skip the question or abandon your survey entirely.
So it's a good rule of thumb to give them the Other option that lets them give an answer in their own words if none of the answer options apply to them.
What to do?
Review your list of answer options to see if you’ve added all the potential answers your respondents will expect.
Incomplete Options
How would you like to be contacted?
What if the respondent prefers phone calls? Or LinkedIn? This list is clearly incomplete.
Comprehensive Options
How would you like to be contacted?
- Phone call
- Text message (SMS)
- Social media (Facebook, LinkedIn, Twitter)
- Other (please specify): __________
Pro Tip: Before finalizing your answer options, run a small pilot test with 5-10 people. If multiple respondents select "Other" and write in the same answer, that option should be added to your main list.
5. Provide an Alternative Answer
There are several scenarios where the respondent can’t or won’t answer a question.
Maybe it's because it asks for their personal information and comes off as too intrusive. Or maybe the question does not apply to them. Sometimes they simply don't have enough information to answer accurately.
In such cases, you need to offer an escape route for these respondents. If you force these respondents to pick an answer, they'll either abandon your survey or pick an answer that is inaccurate, corrupting your data.
Use alternative answers when asking about:
- Personal information (income, age, health)
- Opinions on topics respondents may not have knowledge about
- Experiences they may not have had
- Preferences that may not apply to everyone
To make sure this doesn't happen, you can provide your respondents with answer options such as:
- "Prefer not to answer"
- "Neutral" / "No opinion"
- "Does not apply"
- "I don't know"
- "Not applicable (N/A)"
| Question | Why Alternative Needed | Suggested Option |
|---|---|---|
| "What is your annual household income?" | Too personal/sensitive | "Prefer not to answer" |
| "How satisfied were you with our customer service?" | May not have contacted support | "Did not use customer service" |
| "How likely are you to use our new premium feature?" | May not know enough about it | "Need more information" |
6. Add Labels to Rating Scales
Rating or opinion scale questions provide your respondents with numerical scales that comprise numbers as answer options.
In addition to the numbers you’ve displayed, you need to add labels explaining the value of those numbers.
Without labels, respondents may interpret scales differently:
- Some may think 1 is the best (like rankings)
- Others may think 10 is the best (like grades)
- This inconsistency destroys your data quality
For instance, in an NPS survey, you ask: “How likely are you to recommend us to your friends or colleagues?”, and you provide your respondents with a numerical scale that ranges from 0 to 10.
Now you convey the value of the numbers on this scale with labels. You tell them that 0 means they’re least likely to recommend your business, and 10 means that they’re highly likely to recommend your business to their friends or colleagues.
Best practices for scale labels
✓ Do:
- Label both ends of the scale (minimum and maximum)
- Add a midpoint label for scales with 5+ options
- Use consistent language that matches your question
- Make labels specific and actionable
✗ Don't:
- Assume respondents know what numbers mean
- Use ambiguous terms like "good" or "bad"
- Create scales where higher/lower could be interpreted either way
7. Change the Order of Your Answer Options
Your respondents might be a little disinterested in completing your survey and might speed through it so they can be done with it quickly and move on to whatever interests them.
This is called "satisficing", giving satisfactory rather than optimal answers. Rather than giving you answers that truly reflect their opinion, they blindly pick the same exact option for every one of your questions.
The problem here is this behavior is called "straightlining" and it ruins your data quality.
As a survey researcher, how do you get prevent these and get you your quality responses?
One way to get them to give you accurate answers is by simply reversing the order of the answer options.
For instance, one question could range from “strongly disagree to strongly agree” and the following question could range from “strongly agree to strongly disagree”.
Example: Alternating Scale Direction
Question 1:
"I find this product easy to use."
○ Strongly Disagree
○ Disagree
○ Neutral
○ Agree
○ Strongly Agree
Question 2:
"The product interface is confusing." (Note: This is a negatively-worded question)
○ Strongly Agree
○ Agree
○ Neutral
○ Disagree
○ Strongly Disagree
8. Answer Options Should Be Balanced
You need to keep your response choices balanced. Why?
Because answer options, when not balanced, can introduce bias in your surveys
For instance, if you ask your respondents: “How satisfied are you with our product?” and provide them with these answer options: “Very satisfied”, “Satisfied”, and “Somewhat satisfied”, you assume that your users are satisfied on some level, which normally isn’t the case.
Well, then, how do you keep your choices balanced?
You need to have as many positive choices as negative. You successfully eliminate bias when you have an equal number of positive and negative answer choices.
Examples:
| Question | Biased | Balanced |
|---|---|---|
| "How much do you love our service?" | "Love it, Really like it, Like it" | "Love it, Like it, Neutral, Dislike it, Hate it" |
| "How good is our quality?" | "Excellent, Very good, Good" | "Excellent, Good, Average, Below Average, Poor" |
| "How well did we do?" | "Extremely well, Very well, Well" | "Extremely well, Well, Adequately, Poorly, Very poorly" |
Balanced scales:
- Give respondents the space to be critical
- Produce more accurate data
- Increase trust (respondents see that you want honest feedback)
- Enable better decision-making based on real sentiment
9. Do Not Use Absolutes
Absolutes are words such as “never”, “always”, “worst”, “best”, “all”, “any”, “every”, “ever”, etc.
Response choices with absolutes usually don’t apply to your respondents.
Why? Because respondents can never fully agree or disagree with answer options that use absolutes.
Absolutes make your answer options too rigid and force your respondents to pick an option that’s inaccurate.
The solution is to provide your respondents with a variety of choices that are more specific.
For instance, “once a week — once a month” rather than “never — always”.
Let's see an example:
Using absolutes:
How often do you exercise?
- Always
- Never
These are the only two options? What about people who exercise sometimes? This forces inaccurate responses.
Using specific frequency ranges:
The solution is to provide your respondents with a variety of choices that are more specific.
How often do you exercise?
- Daily (7 days/week)
- 4-6 days per week
- 2-3 days per week
- Once a week
- Once a month
- Less than once a month
- Never
Now respondents can select an answer that actually matches their behavior.
Here's a list of absolute words that weaken your survey:
- Never, always, ever
- All, none, every, any
- Best, worst
- Perfect, terrible
- Completely, totally, absolutely
- Everyone, no one
Use these instead:
- Frequency scales: "Daily, Weekly, Monthly, Rarely, Never"
- Percentage ranges: "100%, 75%, 50%, 25%, Less than 25%"
- Degree scales: "Very often, Often, Sometimes, Rarely, Never"
10. Avoid Too Many Answer Options
The number of answer options you provide your respondents influences their responses.
The reliability of the answers decreases as the number of questions increases.
Respondents are overwhelmed and find it difficult to pick an option when there are way too many options to choose.
You should rank your answer options by importance and not have more than 5 or 6 options.
Wrapping Up: Putting It All Together
Great survey answers make it easy for respondents to be honest.
Writing effective survey answers isn't just about following rules or a checklist...it's about understanding your respondents and making it easy for them to give you honest, accurate feedback.
Use our tips above to write good survey answers that will help you collect high-quality information from your target audience.
Here are some related articles from us to help you learn more about creating and conducting surveys:
- 12 Types of Survey Questions to Gather All Kinds of Information
- The Essential Guide to Writing Effective Survey Questions
- What Are the Different Types of Surveys?
Want to see these principles in action?
Don't just take our word for it. These best practices are used by 1000+ businesses on SurveySparrow to create surveys with.
Looking to create surveys that people love answering? Feel free to check out SurveySparrow.

Create engaging surveys that people actually complete. Try SurveySparrow now!
Kate Williams
Excels in empowering visionary companies through storytelling and strategic go-to-market planning. With extensive experience in product marketing and customer experience management, she is an accomplished author, podcast host, and mentor, sharing her expertise across diverse platforms and audiences.
Frequently Asked Questions (FAQs)
The goal is to collect clear, high-quality feedback that accurately reflects the opinions and experiences of respondents. Well-constructed answer options make data collection and analysis easier while preventing confusion or bias.
When answer options overlap, respondents may be unsure which one applies, leading to inaccurate responses. Making them mutually exclusive ensures clarity and precision.
It means including all possible answer options so every respondent can find one that fits. Adding an “Other” or “Not applicable” choice helps capture any outliers.
Absolutes limit flexibility and rarely reflect real-world experiences. Replacing them with graded options (e.g., “once a week” or “seldom”) increases accuracy.
Ideally, between five and six. Too many options overwhelm respondents and reduce response reliability.
AI-powered survey analysis uses natural language processing to analyze open-ended responses at scale. It identifies common themes, sentiment, and recurring keywords, helping teams quickly understand customer feedback patterns without manually reviewing every response.
Related Articles

Survey & Feedback
SoGoLytics vs. SurveyPlanet: A Comparison
8 MINUTES
28 April 2023

Survey & Feedback
How to Write Qualitative Research Survey Questions: Examples and Best Practices
14 MINUTES
12 August 2024

Survey & Feedback
160+ Website Feedback Survey Questions to Ask in 2025
14 MINUTES
24 January 2022

Survey & Feedback
Online Surveys for Money: Top Platforms, Tips & Strategies
7 MINUTES
10 July 2024
