
Defining Employee Experience Metrics for 2025
The world of workplace analytics has changed a lot. Organizations now look for measurable ways to see how employees feel about their work environment. Traditional HR metrics used to just track attendance or turnover. Now, employee experience metrics give a complete picture of the workforce's involvement, satisfaction, and connection to the organization.
What Are Employee Experience Metrics KPIs?
Employee experience metrics are numbers that show how people see their time with your organization. These metrics track everything from recruitment and onboarding to daily work and eventual offboarding. They give analytical insights into personal experiences. Organizations use them to understand how involved people are, spot problems, and make smart decisions to improve workplace culture.
The best employee experience metrics look at workplace interactions as a whole rather than single moments. They go beyond just measuring how happy people are with pay or benefits. These metrics look at deeper connections like emotional investment, how well people line up with company values, and their willingness to promote the organization.
To name just one example, the Employee Experience Index (EXI) shows how employees feel about their workplace in different ways. This complete score comes from many sources: pulse surveys, involvement data, career growth chances, recognition, fairness, well-being, and trust in leadership. It turns scattered feedback into a stable measurement that leaders can manage well.
Employee experience metrics work differently than old-style engagement surveys. They look at everything in an employee's time with the company. Workplace researchers say employee experience covers physical workspace, tech tools, company culture, career growth, and how people work together.
Why They Matter in a Post-2024 Workplace
Keeping track of employee experience metrics has become more significant today. The global changes of 2020-2023 brought big challenges. Companies had to deal with return-to-office rules, hybrid work adjustments, rising prices affecting workers' money, and questions about their commitment to employee experience.
Recent data shows these problems are systemic. Employee involvement worldwide dropped from 41% to 37% between 2022 and 2023. Culture energy fell from 63% to 59%. Experts think these downward trends will continue through 2025 without active measurement and quick action.
Measuring employee experience brings clear business benefits. Research shows companies with high employee experience scores do better with customer satisfaction. These scores also link to better revenue and profit. Companies with higher involvement scores were more likely to get funding than those with lower scores.
These metrics work as early warning signs. They can spot problems like low involvement, burnout, or people thinking about leaving. HR leaders can find issues before they get worse and focus on fixes that help both employees and the company.
Key Metrics: eNPS, Engagement Index, EES
Three metrics stand out as particularly useful in the 2025 workplace:
Employee Net Promoter Score (eNPS) shows employee loyalty through one simple question: "On a scale of 0-10, how likely are you to recommend this organization as a place to work?" Answers fall into three groups: Promoters (9-10), Passives (7-8), and Detractors (0-6). The eNPS comes from subtracting the percentage of Detractors from Promoters.
The 2025 measurements show interesting industry differences. Hospitality now leads with an eNPS of 37, while government and retail have negative scores. Company size affects eNPS too. Smaller organizations (0-250 employees) score 24, doing much better than bigger companies.
Engagement Index (EI) looks at more aspects of employee involvement. The 2025 data shows an Engagement Index of 6.9, down slightly from 7.1 in Q4 2024. This index looks at three main things: Pride, Advocacy, and Loyalty. It gives a better picture of how employees feel than eNPS alone.
Professional Services and Technology sectors lead with Engagement Index scores of 7.8. Government and Retail fall behind at 6.4. Smaller companies (0-250 employees) score 7.4, while big organizations with 5,000+ employees average 6.7.
Employee Effort Score (EES) measures how hard it is for employees to do their jobs well. Like the Customer Effort Score used in customer experience, EES asks: "How easy was it for you to accomplish [specific task/process]?"
EES finds what makes work harder by showing complex processes, resource gaps, or tech problems. This helps organizations optimize workflows and reduce employee frustration.
Organizations that track these core metrics regularly and compare them to industry standards can create better strategies. These improvements help workplace experience, boost involvement, and lead to better business results in 2025's competitive talent market.
New Engagement Index Benchmarks by Industry
The gap between sectors in employee engagement has reached unprecedented levels in 2025. Recent measurements reveal patterns that are a great way to get insights for HR leaders and executives in all industries.
Engagement Index (EI), Employee Net Promoter Score (eNPS), and survey participation rates across major sectors
| Industry Sector | Engagement Index (EI) | eNPS Score | Survey Response Rate | Performance Status |
|---|---|---|---|---|
| Professional Services | 7.8 | 33 | — | ▲ Top Performer |
| Technology | 7.8 | 26 | 22% | ▲ Top Performer |
| Housing Associations | 7.6 | — | — | ▲ Strong |
| Hospitality | — | 37 | 85% | ▲ eNPS Leader |
| Government | 6.4 | -23 | 79% | ▼ Critical |
| Retail | 6.4 | -13 | — | ▼ Critical |
Top Performing Sectors: Professional Services, Tech, Housing
Professional Services and Technology sectors guide the engagement landscape with impressive scores of 7.8 on the Engagement Index. These industries managed to keep strong engagement levels throughout early 2025 due to several key factors.
Professional Services organizations have intensified their efforts to create meaningful work experiences. They provide clear development pathways and implement strong leadership practices. The Technology sector benefits from innovative workplace practices and makes substantial investments in employee development.
Housing Associations are close behind with a strong Engagement Index of 7.6. This sector has shown remarkable resilience despite economic pressures. Their focus on purpose-driven work and community impact appeals deeply to employees.
The Hospitality sector now leads in employee Net Promoter Score (eNPS) with a score of 37. This shows that even challenging industries can achieve high engagement with the right strategies.
Hospitality also tops participation rates in engagement surveys at 85%. This suggests employees feel safe to provide feedback. Government follows at 79%, while Technology has only 22% response rates. These numbers point to potential challenges in employee voice and communication channels.
Low Scoring Sectors: Government and Retail
Government and Retail sectors face concerning engagement challenges. Both sectors posted Engagement Index scores of just 6.4. These lower scores reflect ongoing problems with employee satisfaction and commitment.
The Government sector's situation is particularly concerning. Their alarming eNPS of -23 shows far more detractors than promoters among employees. Despite high survey participation rates, government organizations don't deal very well with creating positive employee experiences.
The Retail sector's negative eNPS of -13 reveals major workplace satisfaction issues. Both sectors face structural challenges. Recognition concerns, workload imbalances, and work-life balance issues affect retention and morale.
These sectors should focus on trust-building, psychological safety, and clearer career growth opportunities to re-engage their teams. The contrast between high and low-performing sectors shows that industry-specific approaches to engagement are vital.
Engagement Index Drop from 7.1 to 6.9
The overall Engagement Index has fallen from 7.1 in Q4 2024 to 6.9 in Q1 2025. This small drop reveals important changes in the engagement landscape.
Decreasing loyalty scores appear to drive the decline. Employees feel less committed or secure in their roles. January's reputation as a busy time for job changes and broader economic uncertainties could explain this trend.
Company size plays a key role in engagement levels:
- Smaller organizations (0-250 employees): 7.4 Engagement Index
- Larger organizations (5,000+ employees): 6.7 Engagement Index
Closer connections in smaller companies often lead to stronger engagement. Larger organizations face bigger challenges with communication breakdowns, recognition issues, and maintaining cohesive cultures.
This engagement dip aligns with broader global trends. Gallup's research shows U.S. employee engagement hit its lowest point in a decade at the end of 2024. Only 31% of employees were engaged and 17% actively disengaged. Workers under 35 and those in finance, technology, transportation, and professional services sectors saw the sharpest declines.
These measurements help organizations evaluate their engagement initiatives. They can implement targeted improvements based on industry-specific insights rather than general workplace trends.
eNPS Benchmarks 2025: Surprising Shifts
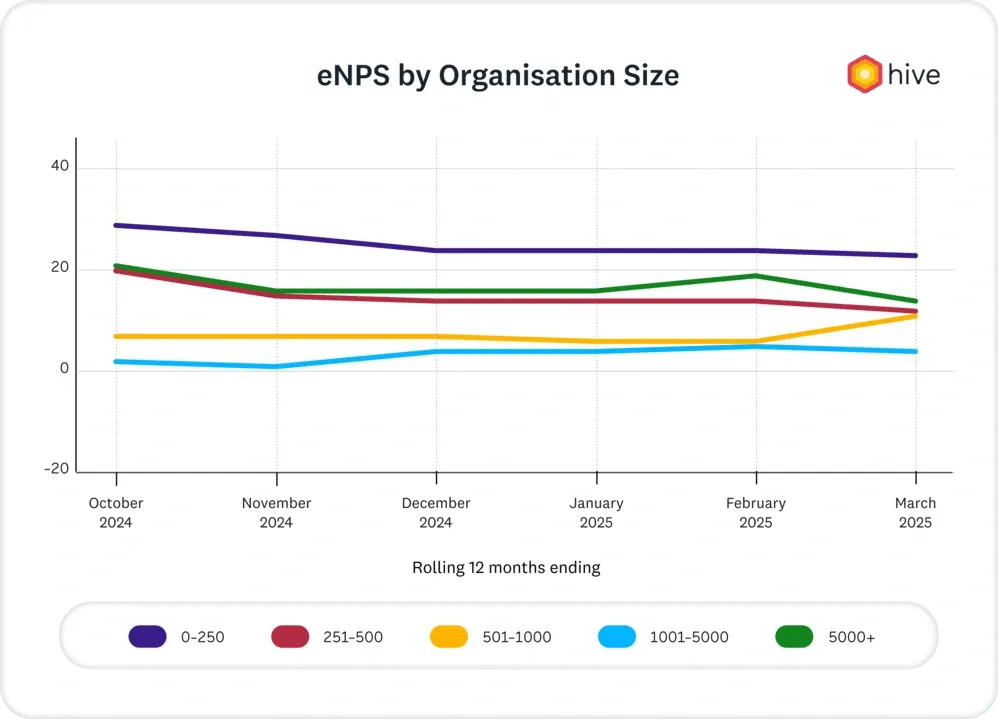
Image Source: Hive.HR
The 2025 Employee Net Promoter Score (eNPS) data shows some fascinating changes in different industries and organizations. Recent standards reveal stark contrasts - some sectors are thriving while others don't deal very well with employee advocacy.
Hospitality Leads with eNPS 37
The hospitality sector has become a game-changer in employee advocacy with an impressive eNPS of 37 in Q1 2025. This achievement stands out because the sector usually sees high turnover and tough working conditions.
The sector's strong performance shows a real change in how these organizations handle employee experience. BambooHR's research backs this upward trend and shows that the travel and hospitality sector began 2025 with a substantial 10% rise from Q4 2024.
The sector's success comes with high survey response rates of 85%. This suggests workplaces where employees feel safe to share their thoughts. High advocacy combined with active participation creates a positive cycle of involvement.
Professional Services follows with an eNPS of 33, while Technology managed to keep a solid 26. Both sectors showed strong employee advocacy in early 2025, thanks to their focus on career growth and flexible work arrangements.
Government and Retail in Negative eNPS Zone
Unlike hospitality's success, Government and Retail sectors face major challenges with employee advocacy. Government organizations show a worrying eNPS of -23, that indicates many more detractors than promoters in their workforce.
The retail sector also struggles with a negative eNPS of -13. These negative scores point to deep problems affecting employee satisfaction and their willingness to recommend their workplaces. Both sectors face structural issues like recognition problems, uneven workloads, and pay concerns that affect retention and morale.
These systemic problems need quick action. QuestionPro's research shows the overall eNPS standard is 31 across all sectors, yet these struggling industries fall well below this mark. Government agencies need to fix growing dissatisfaction, especially since their high survey participation rate of 79% shows employees are speaking up without seeing positive changes.
eNPS by Company Size: 0–250 vs 5000+ Employees
Company size plays a key role in employee advocacy levels. The data shows a clear pattern - as companies grow larger, their eNPS scores drop. Small organizations with 0-250 employees have the highest eNPS at 24, slightly down from their 12-month average of 27.1.
Smaller companies benefit from their tight-knit environments where employees get individual-specific experiences and better team collaboration. Direct connections between employees and leadership build stronger relationships and more involvement.
Large enterprises with 5,000+ employees have much lower scores, ending Q1 2025 with an eNPS of just 14. These organizations saw changes during the quarter as eNPS went from 16 to 19 before dropping again. Such ups and downs show how hard it is to keep employee experience consistent across large, diverse teams.
Mid-sized companies with 251-500 employees kept a steady but modest eNPS of 14 throughout the period. Organizations with 1,001-5,000 employees had the lowest performance with an eNPS of only 4.
These standards highlight how employee advocacy has become a vital metric for organizational health in 2025. HR leaders can learn about their own performance and make targeted improvements by understanding these industry and size-based differences.
Employee Experience by Organization Size
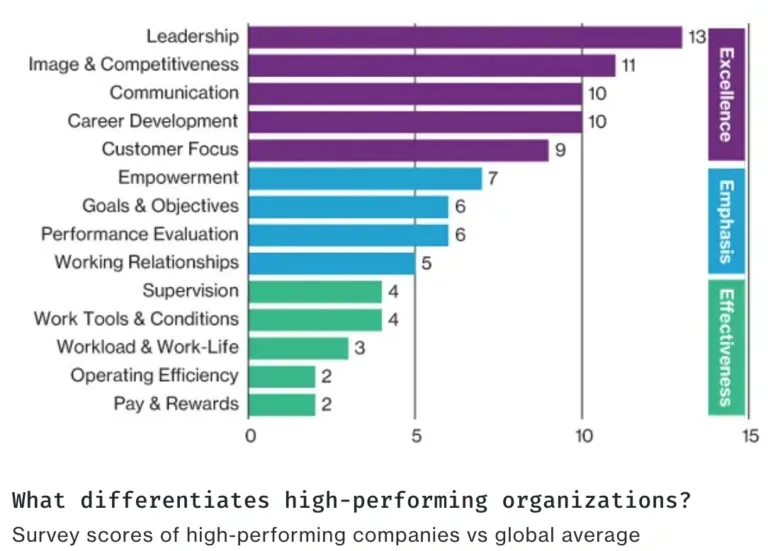
Image Source: Biteable
A company's size shapes its employee experience more than its industry type or location. The 2025 data reveals the sort of thing I love - clear patterns in how different-sized companies connect with their workforce.
Smaller Companies: Higher Engagement Index (7.4)
Smaller organizations perform better than larger ones in employee engagement. Companies with fewer than 250 employees show an impressive Engagement Index of 7.4, which stands well above the average. This difference represents more than just a minor advantage.
The reason becomes clear when we look closer. Small company employees work closer to where decisions happen. The numbers tell the story - 77% of employees in small organizations can provide input on work-related decisions, while only 53% in larger companies have this opportunity.
Small companies excel in several vital areas:
- Better leadership access (close to 80% favorable ratings)
- Better learning and growth chances (79% in first year)
- Clear purpose and goal alignment (89% understanding)
Small organizations achieve these results despite having the lowest survey response rate at 38%. This suggests their actual engagement advantage might be even greater than the data shows.
Larger Enterprises: Communication and Culture Gaps
Companies with over 5,000 employees face distinct challenges, resulting in an Engagement Index of 6.7. This 0.7-point gap compared to smaller companies shows a major difference in how engaged their employees feel.
Large enterprises find it hard to keep engagement consistent in their various teams and locations. Messages often get lost, and employees feel cut off from company decisions. Only 55% of large organization employees believe their input matters.
Large organizations also struggle with:
- Poor recognition—only 48% of employees feel properly acknowledged
- Leaders who aren't visible enough across departments
- Problems keeping their culture strong as they grow
These issues typically get worse as companies expand. The data shows engagement scores drop steadily as companies grow larger. Mid-sized companies (1,001–5,000 employees) sit in the middle with scores around 7.3 by June 2025, up from 7.1 earlier that year.
How company size impacts Engagement Index, eNPS, and survey participation rates in Q1 2025
| Company Size (Employees) | Engagement Index | eNPS Score | Survey Response Rate | Key Advantage |
|---|---|---|---|---|
| 0–250 (Small) | 7.4 | 24 | 38% | Direct leadership access, better communication |
| 251–500 (Mid-size) | 7.1 | 14 | 56% | Balanced growth, moderate engagement |
| 1,001–5,000 (Large) | 7.3 (June 2025) | 4 | 43% | Highest improvement potential |
| 5,000+ (Enterprise) | 6.7 | 14 | 62% | Strong survey infrastructure, culture gaps |
Response Rate Trends by Size: 38% to 62%
Here's an interesting twist - while smaller organizations score higher in engagement, they struggle to get survey responses. The response rates clearly link to company size:
- Organizations with 0–250 employees: 38% response rate
- Mid-sized organizations (251–500 employees): 56% response rate
- Organizations with 1,001–5,000 employees: 43% response rate
- Organizations with 5,001+ employees: 62% response rate
This creates an interesting situation - larger organizations with lower engagement still get more survey responses. They might have better survey methods, stronger follow-up systems, or more resources for collecting employee feedback.
Larger organizations excel at gathering employee input but struggle to create truly engaging workplaces. Small companies create better work environments but lack proper systems to measure employee sentiment.
These insights will shape how organizations measure and improve their employee experience in 2025 and beyond.
Top 5 Drivers of Employee Experience in 2025
Creating an engaging workplace starts with knowing what drives your employees. Research points to five key factors that will shape employee experience in 2025. These insights give organizations a clear path to build their engagement strategies.
Confidence, Motivation & Communication
Employee confidence serves as the life-blood of positive experience in today's workplace. Studies show that employees are 2.7x more likely to stay engaged when they expect recognition. Good communication makes a big difference too. Leaders who communicate during tough times build trust through meaning-making (0.15), empathetic (0.60), and direction-giving language (0.27). Leaders who state organizational values clearly and link personal goals to bigger purposes help create motivation that boosts performance and commitment.
Leadership Behaviors and Trust
The quality of leadership directly shapes how people experience their workplace. Employees with inclusive managers have better chances of getting promotions and new opportunities. Yes, it is true that employees who see their HR departments working well show higher commitment to their organizations (62% vs 22%) and feel more satisfied with their jobs (71% vs 45%). Leaders who show integrity and support consistently create a safe environment where employees can do their best work without worry.
Inclusion, Belonging, and Fairness
A sense of belonging has become a powerful force in shaping employee experience. People who feel they belong show much higher commitment to their organizations. Fair treatment at work affects engagement directly - research shows it can boost employee engagement by 21%. This connection to the workplace encourages loyalty and extra effort, making inclusion programs vital for organizational success.
Reward, Recognition, and Stability
Recognition plays a key role in keeping employees engaged. While only 35% of employees receive recognition monthly or weekly, half of all workers want more acknowledgment for their work. Workers now focus on total rewards (42%) as economic pressures rise, and 46% worry about how inflation affects their pay. These numbers emphasize why both financial security and emotional validation matter in creating positive experiences at work.
Growth, Learning, and Development
Professional development opportunities help keep employees engaged and loyal. Companies that invest in learning see real benefits - 76% of employees stay longer with companies that offer ongoing training. Learning also gives work more meaning, with 80% of employees saying it adds purpose to their work. Organizations need to create clear paths for skill building and career growth to keep their workforce motivated and ready for 2025's changes.
From Metrics to Action: Turning Data into Strategy
Employee experience metrics collection marks just the start—the real value lies in turning this data into meaningful action. Companies that excel at this transformation consistently beat their competitors. They tackle workplace challenges before these issues grow into bigger problems.
Using Hive Actions and Action Grids
Hive Actions offers a structured framework that turns employee feedback into real improvements. Traditional approaches often lead to scattered tasks or unproductive meetings. This system creates clear, trackable paths for implementation. The process starts when teams identify main concerns through employee feedback and create specific action items with assigned responsibilities.
Action Grids help teams visualize and prioritize initiatives based on their potential effect and feasibility. Teams can spot "quick wins" versus longer-term strategic initiatives by plotting actions on a grid that measures importance against required effort. This visual method helps allocate resources to changes that will create the best improvements in employee experience.
Companies must move beyond just collecting feedback to establish accountability. The RACI model (Responsible, Accountable, Consulted, Informed) helps assign clear ownership and makes sure nothing gets overlooked.
Segmenting Data for Targeted Interventions
Workforce segmentation creates more tailored and effective employee experience strategies. Data breakdown by department, role, location, or demographic factors shows unique needs and challenges instead of using one-size-fits-all solutions.
You might find that:
- Engineering teams want career development opportunities
- Customer service representatives value recognition systems
- Remote workers need better communication tools
This detailed understanding helps allocate resources better. McKinsey's research shows searchable knowledge archives can cut information search time by up to 35%. Companies can shape initiatives to fix specific pain points rather than rolling out broad programs with limited effect.
Ready to collect segmented employee feedback for targeted action planning? SurveySparrow's customizable survey templates can help you collect the precise data you need to develop effective interventions for each employee segment.
14-day free trial • Cancel Anytime • No Credit Card Required • No Strings Attached
Linking Benchmarks to Retention and ROI
Employee experience metrics must tie to business outcomes to show value. iSolved's research reveals 90% of employees say their experience directly shapes the customer experience they provide. This makes employee experience crucial for business success.
ROI calculation for employee experience initiatives requires:
- Identifying specific benefit areas (productivity, turnover reduction, enhanced recruiting)
- Estimating associated costs and benefits
- Dividing net benefits by overall investment and multiplying by 100
Companies with high employee engagement see 23% higher profit compared to those with low engagement scores. Better employee engagement reduces absenteeism by 41% and raises productivity by 17%.
These metrics in leadership conversations transform employee experience from a "nice-to-have" into a strategic business necessity with measurable financial impact.
Conclusion
Employee experience metrics have evolved by a lot and become vital tools for organizations in the complex digital world of 2025. The data shows several surprising trends you should know about.
The contrasts between industries stand out clearly. Hospitality now guides with an impressive eNPS of 37—a soaring win for a sector that usually sees high turnover. The Government and Retail sectors show negative scores, suggesting they need urgent help. These stark differences show that industry-specific approaches to involvement are vital instead of one-size-fits-all strategies.
Size of the company makes a big difference. Smaller organizations perform better than larger ones with an Engagement Index of 7.4 compared to 6.7 for enterprises with 5,000+ employees. Closer leadership connections, better communication, and a stronger sense of purpose in smaller workplaces create this gap.
The metrics tell quite a story when tracked well. A slight drop in overall Engagement Index from 7.1 to 6.9 shows subtle but important changes in employee sentiment that we need to address. These early warning signs could slip by unnoticed without regular measurement.
The five key drivers are the foundations of improving your employee experience. These include confidence and communication, leadership behaviors, inclusion and belonging, reward and recognition, and growth opportunities. Companies that excel in these areas see higher engagement, lower turnover, and better business results.
Without doubt, the most valuable lesson shows that collecting metrics alone won't help. You need to turn insights into targeted actions through well-laid-out frameworks like Hive Actions and segmentation strategies. These efforts linked to business outcomes make employee experience a strategic business priority, not just an HR initiative.
Organizations that become skilled at these metrics will have big competitive advantages ahead. Challenges exist, especially when you have larger enterprises and struggling sectors, but the standards show clear paths to improvement. Your organization's success in attracting and keeping top talent through 2025 and beyond depends on knowing how to measure, understand, and act on employee experience data.


