Customer Experience
Customer Experience Dashboard: How to Use It for Sharper Insights
Article written by Kate Williams
Content Marketer at SurveySparrow
7 min read
19 September 2025

This Blog Covers
Definition
A centralized dashboard that aggregates customer data—surveys, social media, reviews, CRM, etc.—into clear visual insights on sentiment, behavior, and satisfaction
Key features
- Segmentation (by demographics, behavior, geography)
- Reporting with KPI trends and insights
- Behavioral analytics (campaign engagement, browsing, purchase patterns)
- Customization per team’s needs
- Real‑time monitoring + alerting for sudden changes
- Integrations & scalability across data sources
Dashboard types/examples
- Customer Insight Dashboards: Deep dives into segments/personas.
- NPS Dashboards: Track Net Promoter Score and sentiment trends.
- Review Dashboards: Monitor reputation across review platforms.
- Journey Dashboards: Map every touchpoint to spot friction.
Best practices for use
- Set clear CX objectives (e.g., CSAT, NPS, churn).
- Pull data from all customer-facing channels.
- Tailor views per department (marketing, sales, support).
- Employ impactful visualizations.
- Set alerts to catch and act on issues early.
Managing customer experience can get messy. Between surveys, support tickets, reviews, and team feedback, it’s easy to feel like you’re drowning in data with no clear direction.
That’s where a Customer Experience (CX) Dashboard comes in. Think of it as your command center—a place to bring all your insights together so everyone (from marketing to support) is on the same page and working toward the same goal: a better experience for your customers.
In this article, we’ll break down what a CX dashboard is, why it matters, and how to build one that actually helps—not just looks good.
In this article, we will explore:
- What a customer experience dashboard is
- Features to look for
- Different examples of customer experience dashboards
- How to use CX dashboards effectively
What is a Customer Experience Dashboard?
Imagine having critical data about your customers at your fingertips—but in a visually appealing and user-friendly way. That’s precisely what a Customer Experience Dashboard is.
Customer experience dashboards act as information hubs. They merge data from various sources—like surveys, review sites, social media and more.
Through them, we get an overview of customer sentiment, preferences, satisfaction levels—anything that you’re tracking in your CX program.
SurveySparrow allows you to visualize all of your customer metrics and initiatives in one place. Additionally, you can create stunning dashboards for every type of customer journey. For instance, check out our customer journey mapping dashboard!
Start creating your CX dashboard for free. Enter your email below.
14-day free trial • Cancel Anytime • No Credit Card Required • No Strings Attached
Features to Look For:
Here are some key features to look for in a customer experience dashboard.

Segmentation
One of the core features of a Customer Experience Dashboard is the ability to segment customers based on various criteria. These include demographics, purchase history, engagement levels, or geographic location.
By dividing customers into segments, businesses can analyze the data and trends specific to each group. This helps them find opportunities for targeted marketing efforts.
Reporting
This allows businesses to generate detailed reports that summarize customer insights over time. It shows trends, highlight key performance indicators (KPIs), and provide actionable insights.
This helps teams understand how well they are meeting customer needs, and where they can improve.
Behavioral Analysis
This includes tracking customer engagement with marketing campaigns, website browsing patterns, product preferences, and purchase history.
What's the purpose? To learn how customers engage with your brand, what drives their purchasing decisions, and how to refine your CX accordingly.
Customizability
Customizability is crucial because every business has unique needs. A good dashboard should allow users to tailor the layout, metrics, and data sources according to their needs.
This way, each team can focus on the information that matters to them.
Real-time Monitoring
A dynamic customer experience dashboard provides real-time monitoring of customer behavior and engagement. This allows businesses to respond to any changes or issues.
As they say in business, time is money. Real-time monitoring helps brands respond on time, and reduce the risk of losing customers.
Alerting
An alerting feature is essential for notifying teams about significant changes.
For instance, if there’s a sudden drop in customer satisfaction scores or an increase in complaints, alerts can prompt immediate action. This proactive approach helps maintain positive customer relationships.
Integrations
To create a comprehensive Customer Insight Dashboard, businesses need to integrate data from various sources. This sources may include CRM systems, social media platforms, website analytics, and customer support interactions.
By bringing together data from different touch points, companies gain a holistic view of customer interactions and preferences. This enables them to make the right decisions.
Scalability
Scalability ensures that as a business grows or changes, its dashboard can adapt. A scalable dashboard can handle more data volume and complexity without sacrificing performance.
This means it should be able to grow with the business and continue providing insights as new products are launched or new markets are entered.
Examples of Customer Experience Dashboards
Let's check out some examples of customer experience dashboards and their different uses.
Customer Insight Dashboard

A customer insight dashboard is like an upgraded version of a CX dashboard. While the latter gives you a broad view of how customers feel overall, the insight dashboard zooms in on specific customer groups or personas.
Businesses can understand the unique traits, behaviors, and preferences of different audience segments. With this information, you can craft on-point marketing and experiences that resonate with each group.
In short, a customer insight dashboard helps businesses connect with their customers on a more personal level.
NPS Dashboard

An NPS dashboard is a vital part of a Customer Experience Dashboard. It is basically a Net Promoter Score (NPS) tracker that reveals how customers feel about your brand. This tool not only shows the overall sentiment but also helps businesses track NPS scores over time.
The NPS dashboard compiles all the data from your NPS surveys and presents it in various visual formats— like trend charts and sentiment graphs. This makes it simple to understand customer loyalty at a glance.
Here’s how to create an NPS dashboard in SurveySparrow.
Customer Review Dashboard

When you combine online reviews into your customer experience dashboard, this creates a customer review dashboard. It effectively measures your online reputation.
With SurveySparrow's Reputation Management, you can create customer review dashboards to track data from over 100 different sites. This allows you to quickly identify negative feedback and respond promptly, minimizing any damage.
Customer Journey Dashboard

A customer journey dashboard maps out every touchpoint and interaction a customer has with your business.
This dashboard helps identify pain points along the journey, enabling businesses to streamline their processes and improve the overall customer experience. By understanding where customers face challenges, companies can make informed decisions.
The result is enhanced satisfaction at each stage of the journey.

Read: How to Create a Customer Experience Dashboard in 7 Steps
How to Use a Customer Experience Dashboard: Best Practices
Once you create a customer experience dashboard, here are some tips to use it effectively.
1. Define Your CX Objectives
Start by clearly defining your customer experience goals. These KPIs should align with your broader business objectives. Common metrics tracked include:
- Customer Satisfaction (CSAT)
- Net Promoter Score (NPS)
- Customer Churn Rate
- First Response Time (FRT)
2. Integrate Data from All Customer Touchpoints
Gather data from various platforms—customer feedback surveys, social media engagement, CRM systems, and customer service platforms.
Ensuring accurate, up-to-date data from all sources will offer a holistic view of the customer journey.
3. Customize the Dashboard for Stakeholder Needs
Different departments within your organization may require different views of the CX data.
Customize the dashboard so that marketing teams, sales departments, and customer support teams have access to the insights most relevant to their work.
4. Use Data Visualization for Quick Insights
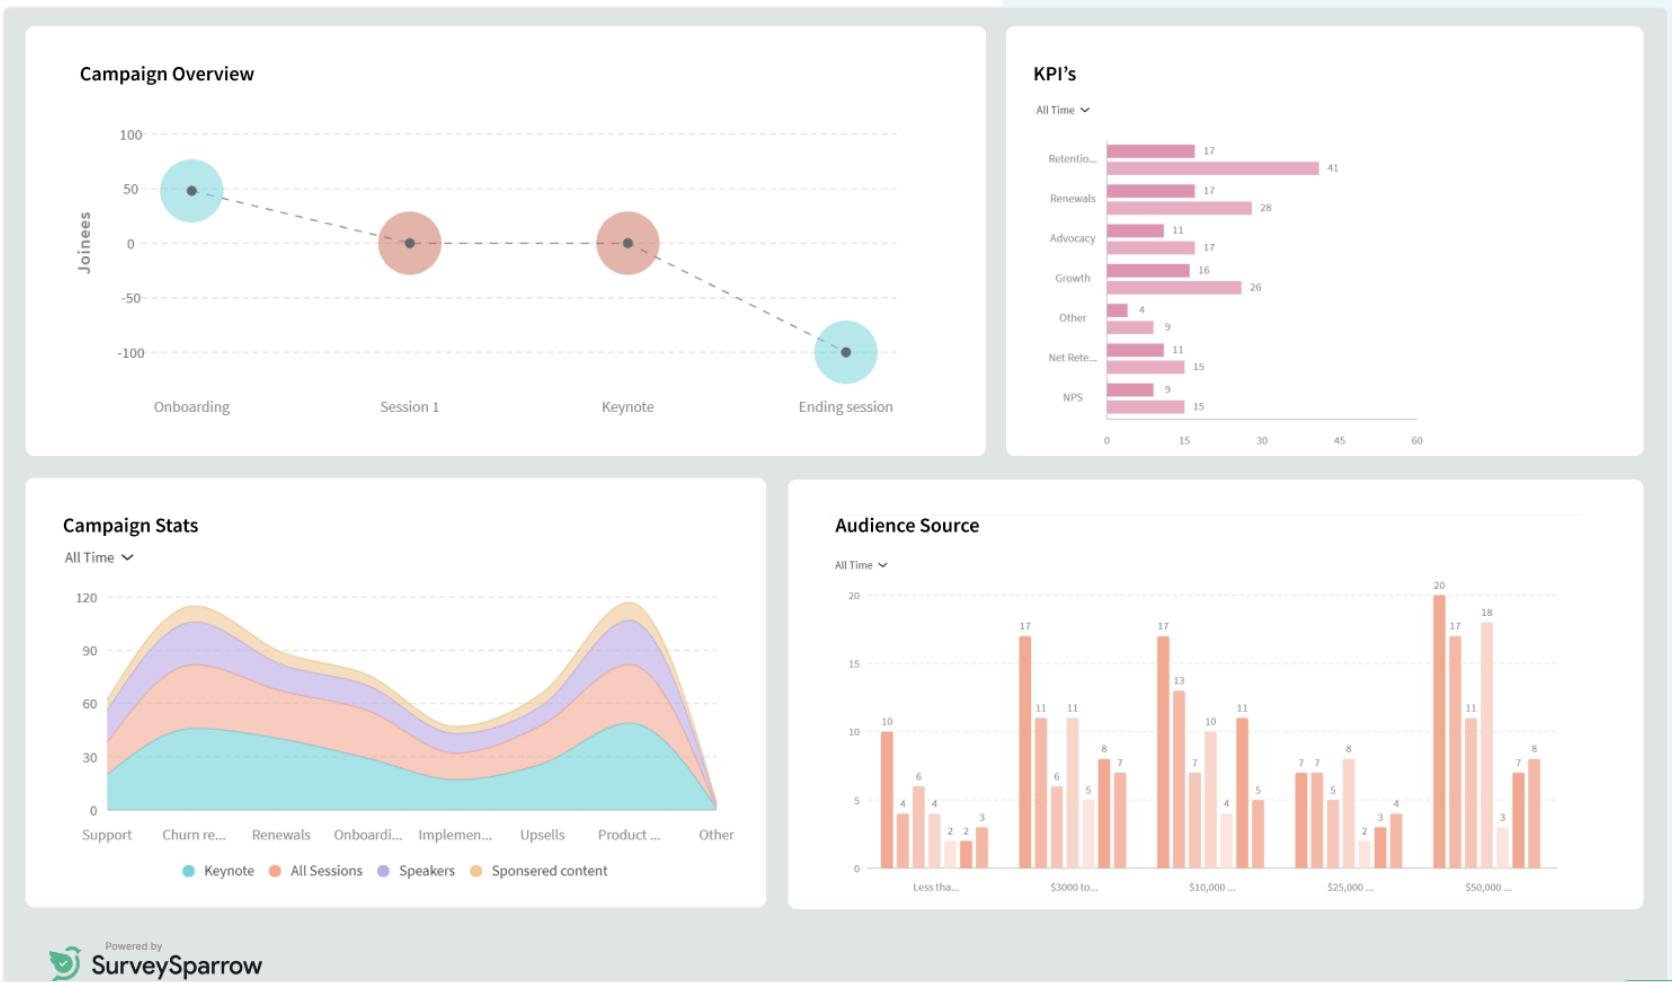
Present your data in a clear and visually compelling format. Use color-coded charts, graphs, and icons to highlight critical information like customer sentiment or changes in NPS.
A well-designed dashboard ensures stakeholders can interpret data at a glance.
5. Monitor and Act on Key Metrics
Set automated alerts for significant shifts in key metrics. This real-time monitoring allows your business to address issues like customer dissatisfaction or churn as they arise.
This is the best way to ensure proactive CX improvements.
Wrapping Up
The customer experience dashboard is a powerful tool that empowers businesses to enhance their customer experience strategies.
So, utilizing this centralized hub of data, organizations can gain valuable insights, make decisions, and drive improvements in customer satisfaction and loyalty.
Remember, it’s not just about collecting data; it’s about using that data to shape exceptional customer experiences. With tools like SurveySparrow, you can visualize all of your customer metrics in one place, and get the answers you need to act.
Start building your customer experience dashboard for free. Sign up below.
14-day free trial • Cancel Anytime • No Credit Card Required • No Strings Attached

Make your customers feel heard. Turn feedback into loyalty with SurveySparrow's CX platform.
Kate Williams
Frequently Asked Questions (FAQs)
A CX dashboard is a visual tool that brings together customer feedback, behavior, and satisfaction data from different sources—like surveys, CRM, reviews, and support tickets—into one place. It helps teams quickly spot trends, issues, and opportunities to improve customer experience.
Without it, your customer data stays scattered. A CX dashboard gives you a real-time, holistic view so you can make faster, smarter decisions that actually impact customer satisfaction and loyalty.
It depends on your goals, but most dashboards track metrics like Net Promoter Score (NPS), Customer Satisfaction (CSAT), churn rate, sentiment analysis, and channel-wise feedback. Visualization tools like trend lines, heatmaps, and pie charts help make the data actionable.
Yes! Modern dashboards (like those from SurveySparrow) integrate easily with CRMs (like Salesforce), helpdesks (like Zendesk), social platforms, analytics tools, and more.
Related Articles

CX
13 Amazing Customer Experience Examples You Should Know About
9 MINUTES
22 June 2023

CX
12 Tips For Exceptional Omnichannel Customer Experience
16 MINUTES
22 June 2019

CX
What is Customer Experience Analysis: A Comprehensive Guide
13 MINUTES
7 March 2023

Customer Experience
7 Ways to Optimize Your Customer Journey Touchpoints
11 MINUTES
9 May 2018
